



The Market Rally Faces a Fresh Test in Q4 on Resurgent Geopolitical Volatility
 John Mullane
28.10.2026
The third quarter brought renewed volatility across global financial markets as the breakdown in the US-Iran ceasefire triggered a sharp rebound in commodity prices, fuelling concerns that inflationary pressures would linger. A global recalibration of interest rate expectations followed which, combined with increased bond issuance and concerns on government borrowing levels, drove yields higher across the curve. These factors also contributed to fluctuations in currency markets. Despite these headwinds, global equities continued to grind higher, supported by resilient economic growth and strong corporate earnings.
Given the strong fundamental backdrop, we remain constructive on risk assets into the final quarter of 2026. The compression in valuation multiples has improved the attractiveness of equities, however, higher bond yields are providing increased competition for investor capital, making the delivery of strong corporate earnings, particularly within tech, increasingly important in supporting further market gains during Q4. This will be particularly relevant in the US, where investment in artificial intelligence remains an important driver of both economic activity and corporate earnings growth. The quarter will also see voters go to the polls in the US mid-terms, an event that has been associated with heightened volatility given its implications for the policy outlook. However, markets have historically responded favourably once the outcome of the election becomes clear and uncertainty begins to recede.
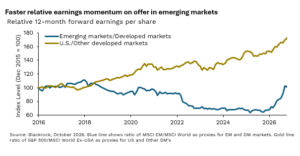
Political developments will also remain a key consideration in Europe, where ongoing French budget negotiations have heightened concerns around the country’s fiscal position. Whilst a prolonged deadlock could contribute to further volatility in European bond markets, the impact on equities is likely to be more limited, with increased investment in infrastructure and defence helping to underpin a significant improvement in corporate earnings growth. Emerging markets should also continue to offer attractive opportunities, supported by improving relative earnings momentum, particularly in Asia, where strong global demand for semiconductors and advanced electronics is boosting export growth and broader economic activity.
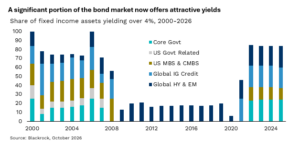
In fixed income, higher yields have significantly improved the range of income opportunities available across the asset class. However, persistent inflation and elevated government borrowings are likely to create increasingly divergent outcomes across regions and sectors, reinforcing the importance of careful credit selection and active duration management. Elsewhere, Infrastructure remains a preferred asset class, supported by structural investment themes including electrification and energy security, whilst gold continues to offer valuable diversification against geopolitical and fiscal uncertainty.
Looking ahead, whilst resilient economic fundamentals and strong corporate earnings continue to support markets, geopolitical developments are likely to drive heightened volatility across and within asset classes. As a result, maintaining a diversified portfolio that is actively managed will be critical in navigating the evolving market backdrop and capitalising on emerging opportunities.
Written by John Mullane, CIO, Cantor Fitzgerald Ireland
(originally written on the 15th of October 2026)