



Market Outlook: Ample Opportunities Amid Market Volatility
 John Mullane
28.07.2026
Market Outlook: Ample Opportunities Amid Market Volatility
Over the course of the second quarter of 2026, easing tensions between the US and Iran, coupled with accelerating corporate earnings growth, particularly among AI enablers, provided a strong tailwind for financial markets. Global equities rallied by almost 15% in euro terms, marking their strongest quarterly performance since the post-pandemic recovery of Q2 2020. Meanwhile, global bond markets delivered modestly positive returns as tightening credit spreads and solid income helped offset yield volatility driven by shifting inflation expectations.
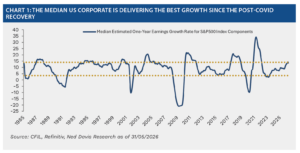
Looking forward, while geopolitical risks remain, the re-escalation of the Middle East conflict is likely to be short-lived, tied to the realpolitik of the upcoming mid-term elections. As a result, we remain constructive on risk assets supported by resilient economic fundamentals and broadening earnings momentum. In the US, while tech continues to lead, earnings growth for the median US company is running at the highest level since the post-COVID recovery buoyed by pro-cyclical fiscal policy, deregulation and AI benefits, which are now stretching well beyond Silicon Valley. This growth should act as a tailwind for US stocks, however with equity market volatility typically elevated in the first six months of a new Fed chair’s tenure and positioning increasingly crowded in certain pockets of the market, an active approach to portfolio construction remains essential to effectively manage risk.
International equities are currently on track to outperform their US counterparts for a second consecutive year, supported by attractive relative valuations and robust growth in emerging markets, which remains a key beneficiary of the ongoing AI investment cycle. In Europe, earnings momentum is also improving, particularly within the capital goods, banking and semiconductor sectors. Recent geopolitical tensions, however, have highlighted the region’s vulnerabilities in energy and defence. Progress on boosting investment in these strategic areas during Ireland’s current Presidency of the Council of the European Union would be well received by investors.
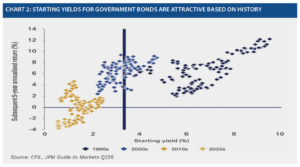
In fixed income, we view the fresh spike in energy prices as temporary and as a result any additional monetary tightening from developed market central banks should be modest. Against this backdrop, a neutral allocation to bonds is justified given global aggregates offer attractive starting yields of close to 4.0% and sticky inflation will likely erode the real value of cash alternatives. Inflation protection is also available through Infrastructure, which enhances portfolio diversification while also representing a key conduit through which supranational priorities such as decarbonisation and electrification can be achieved and, as such, remains a preferred asset class.
Looking ahead, we remain constructive on the investment outlook, supported by strengthening earnings growth and resilient economic fundamentals. While continued volatility is likely, it remains the price investors pay for the superior long-term returns on offer in financial markets. Within this environment, maintaining diversified portfolios and a disciplined, active investment approach remains the best way to capture opportunities while managing risk.
Written by John Mullane, CIO, Cantor Fitzgerald Ireland
(originally written on the 13th of July 2026)